- We design a Liberation Index to track market expectations of tariffs.
- Based on FX Options trade activity, it looks at USDCAD, USDMXN, USDCNY and EURUSD markets.
- It is a novel way to use transparency data.
Today is meant to be Trump’s so-called “Liberation Day” with tariffs potentially being activated with some of the largest trading partners of the US. It is surely no coincidence that it is happening on April Fool’s Day.
Just for the sake of it, I wondered what a “Liberation Index” might look like. What are the chances of these tariffs actually happening and sticking around? Are reciprocal actions being priced in from different countries?
Why An Index?
I cannot be alone in getting bored of Trump headlines, leading me to consciously discount each new Trump announcement regarding tariffs. I would prefer to just follow a number rather than wade through the headlines (and let’s face it there is very little substance behind the headlines during a Trump Presidency).
So I will construct a very basic index. The index amalgamates three measures of market activity, looking to assess the current market consensus on tariffs. Good, bad, ugly or just noise?
What Elements Could be in an Index?
First up – what should we even be looking at? I suggest:
- FX markets.
- Specifically, FX Options (it just so happens that we have data on those!).
- Volumes and prices.
- Concentrate on USDCAD, USDMXN, USDCNY and EURUSD – the economies where tariffs have most frequently been talked about.
Volumes
SDRView provides trade-level details for these four currency pairs traded by US Persons. The data may be a little patchy for USDCNY, but the other three currency pairs should be really well represented. What do we see?
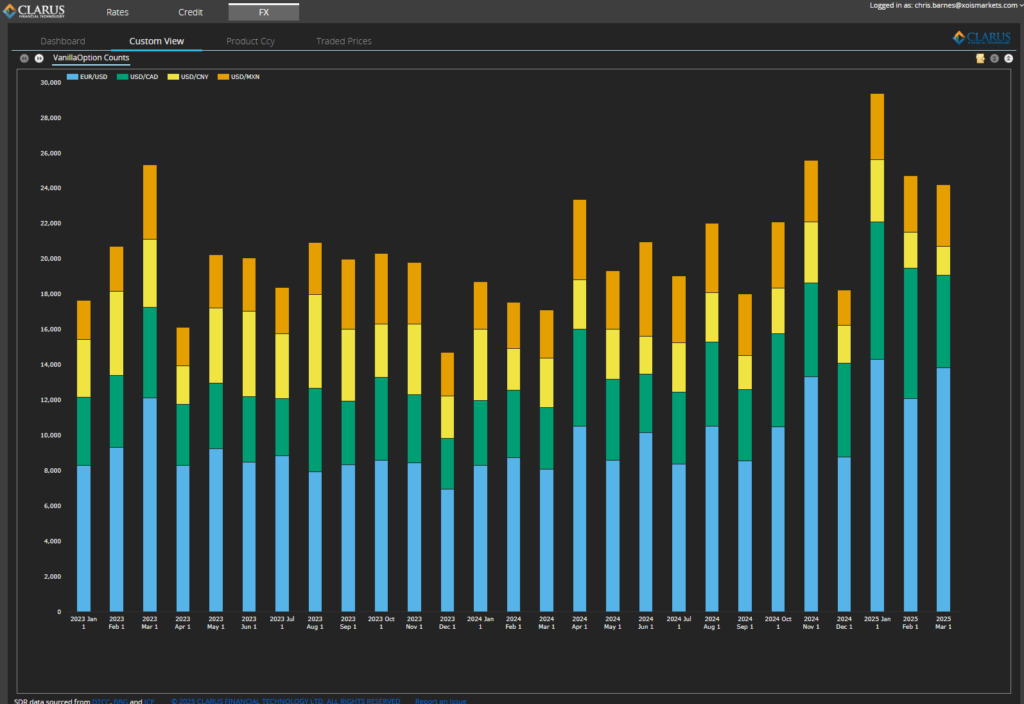
Showing;
- Elevated amounts of activity in FX Options during Q1 2025.
- Q1 2025 has seen more FX Options trade in these four currencies than ever before. Forget COVID, bank runs, global market routs and elections. Thank you, Don.
- How do we measure the increase in activity?
- Q1 saw 30% more FX Options trade than any quarter during 2024.
- Let’s incorporate that into our Index, with a monthly “base” of 20,000 FX Options equal to the average during 2024.
Notionals
Half of the market is transacted on-SEF. We can therefore use SEFView to monitor the volumes in these four currency pairs.
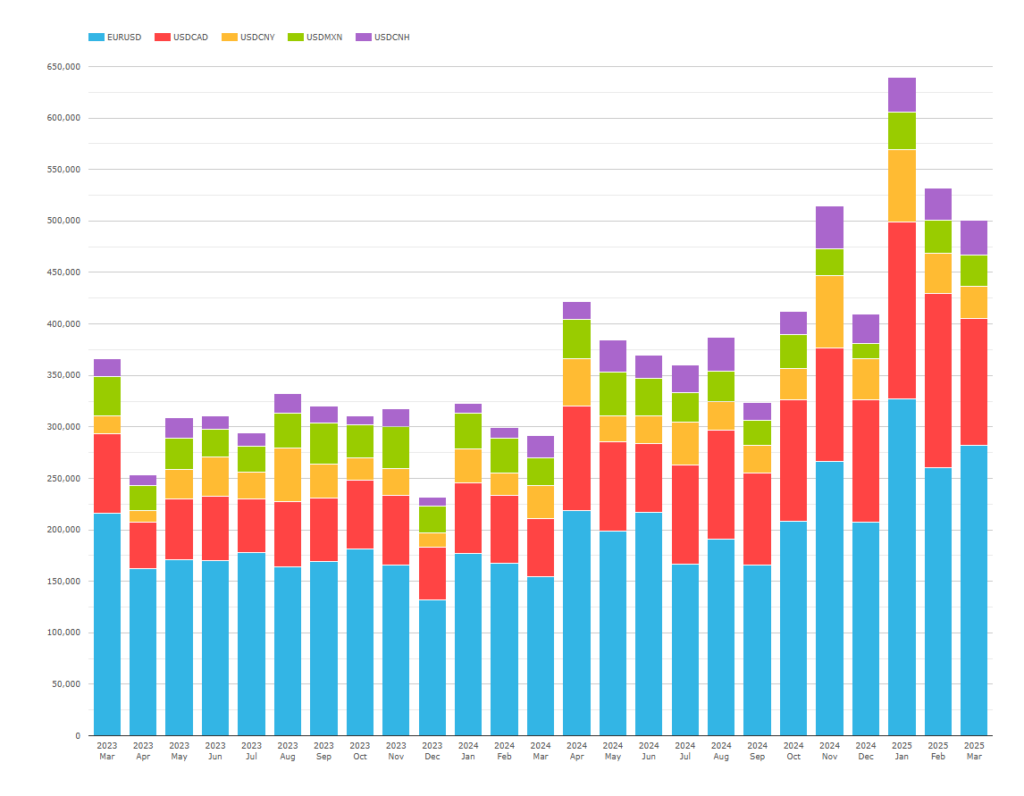
Showing;
- Also an all-time record for volumes.
- The increase in notional amounts is even more impressive.
- 2025 Q1 saw nearly 50% more volumes trade than an average quarter in 2024 (which were already impressively high).
- An average month sees $375bn trade on-SEF in these currency pairs.
- (Strangely, we do not see the USDCNH option activity in SDRView. One to investigate).
Prices
SDR data includes both notional amounts and premiums paid for options. We are just trying to build a crude index here, so let’s keep it simple. I will track the overall percentage of notional paid as premium:
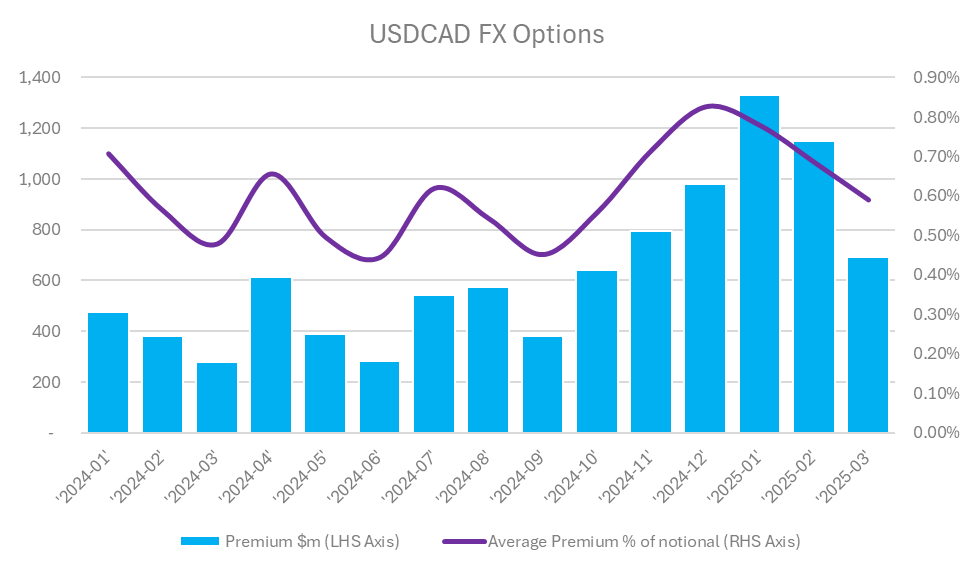
Showing;
- Premiums reached 0.68% of notional in Q1 2025, substantially higher than 2024 levels.
- We can see that both January and February were records (hardly surprising).
- Let’s take a 2024 monthly average as 0.55%.
- Premiums (for USDCAD alone) are some 13 basis points higher this year.
Constructing the Index
If we arbitrarily base December 2023 at an Index level of 100, we can combine number of trades, notional and prices in a simplistic way:
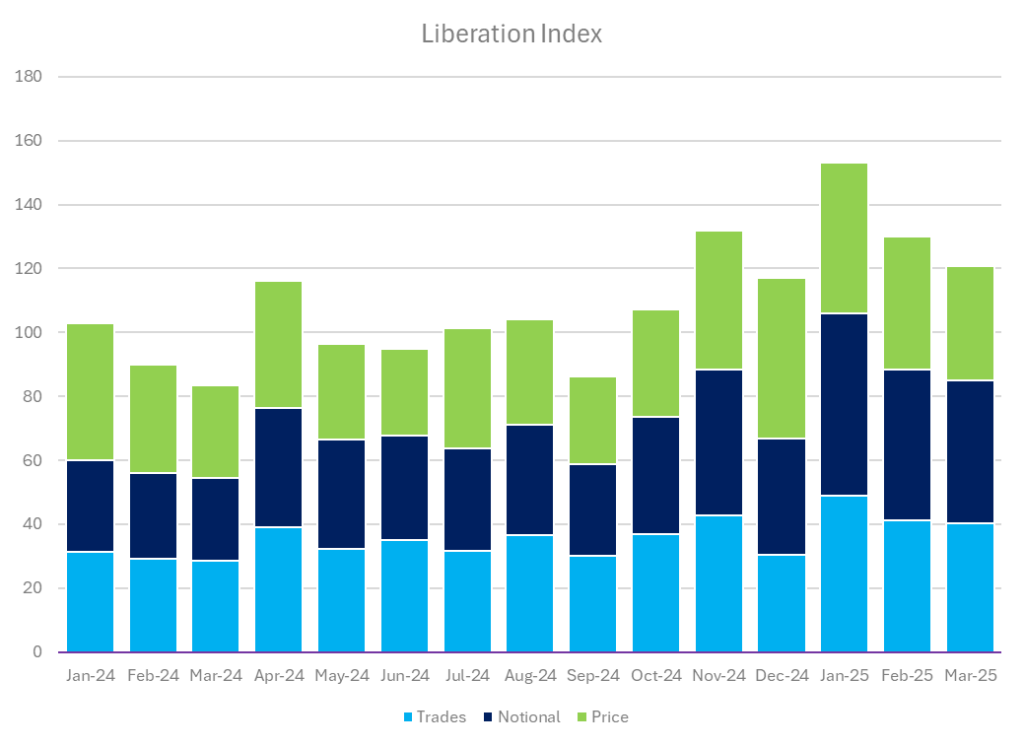
Showing;
- Contribution of number of trades, notional and price to our Liberation Index, with a base of 100.
- We track the relative number of trades relative to 20,000 per month, the notional to $375bn per month and the average premium paid as 0.55% of notional.
- This is just a crude approximation of what a Liberation Index should be. It is probably unfair to include two measures of volume (trade count and notional), and I am only considering the prices of USDCAD options here.
- Realistically, it is not that far away from a VWAP on premiums paid.
- Also, looking at a relative change in premium may not be the wisest approach – absolute moves may be a better indicator here.
- Nevertheless, the behaviour of the index tracks the narrative well, with it peaking immediately after the election, and then again in January after inauguration.
- It seems worthy to at least track it, or develop it further.
Data
This is a simple exercise to demonstrate why transparency data is so powerful. This is all public data, and yet can be combined in unique and interesting ways to create potentially powerful monitoring tools.
In Summary
- Purpose of the Liberation Index: In response to rising US tariff threats under Trump and the saturation of political headlines, I propose a simplified “Liberation Index” to quantitatively track market sentiment and reaction—focusing on FX markets—as an alternative to headline-chasing.
- Construction of the Index: The index combines three market indicators—number of FX option trades, total notional traded, and average premiums paid—primarily for USDCAD, USDMXN, USDCNY, and EURUSD. Q1 2025 saw record highs across all three, suggesting elevated market concern or positioning around tariff risks.
- Key Insights and Implications: The constructed index shows notable spikes post-election and inauguration, aligning with political developments. While admittedly simplistic, it highlights the value of public market transparency data for building bespoke indicators to track economic or political narratives.