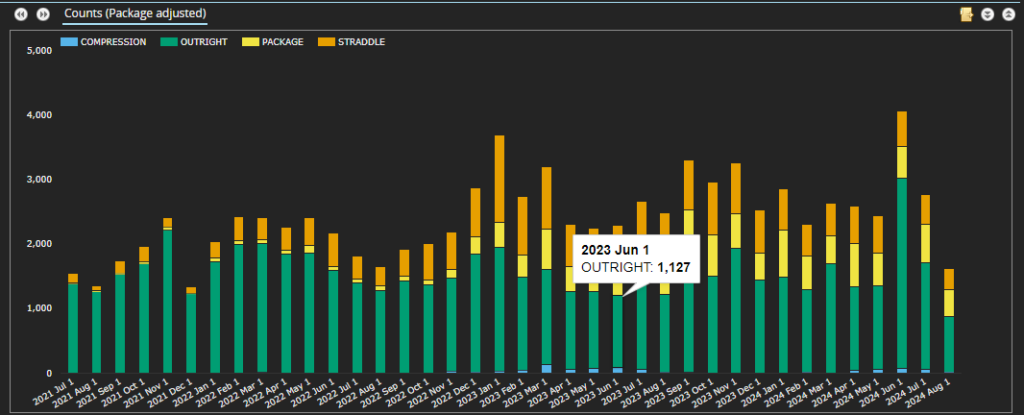
June 2024 saw the largest number of EUR Swaptions reported to SDRs in the past three years:
Showing;
- The number of EUR Swaptions reported each month.
- June 2024 appears to be the largest number ever reported to SDRs.
- These trade numbers show an increasing number of “packages” trading.
- Only one leg of each straddle is counted in the data above.
- June 2024 saw a huge spike in the number of outrights traded.
My interest in EUR Swaptions was sparked by a recent Risk.net article;
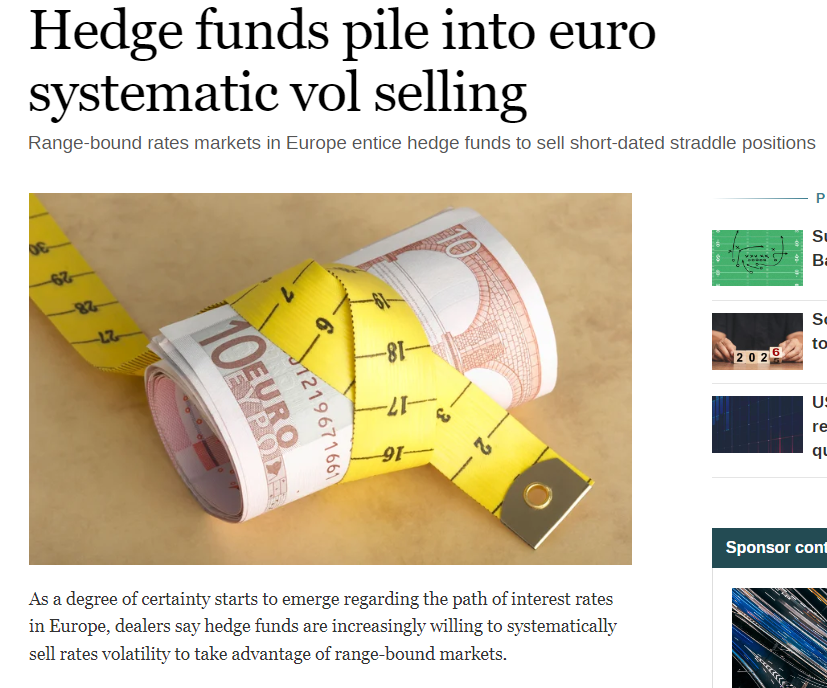
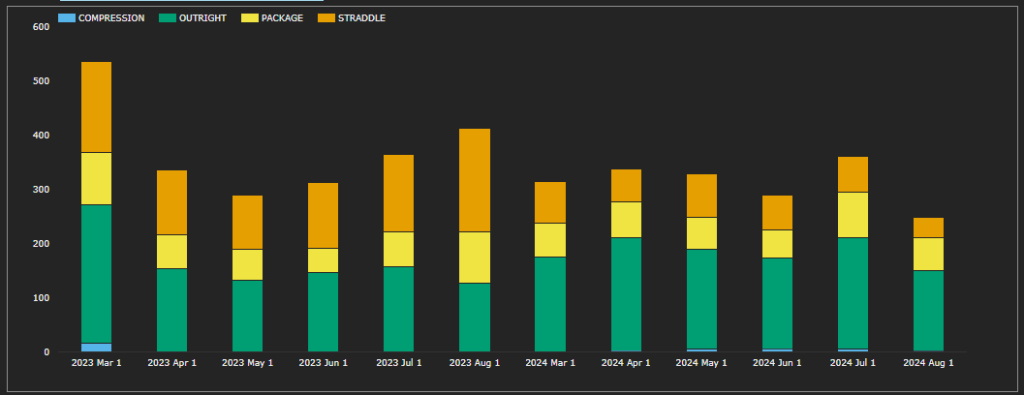
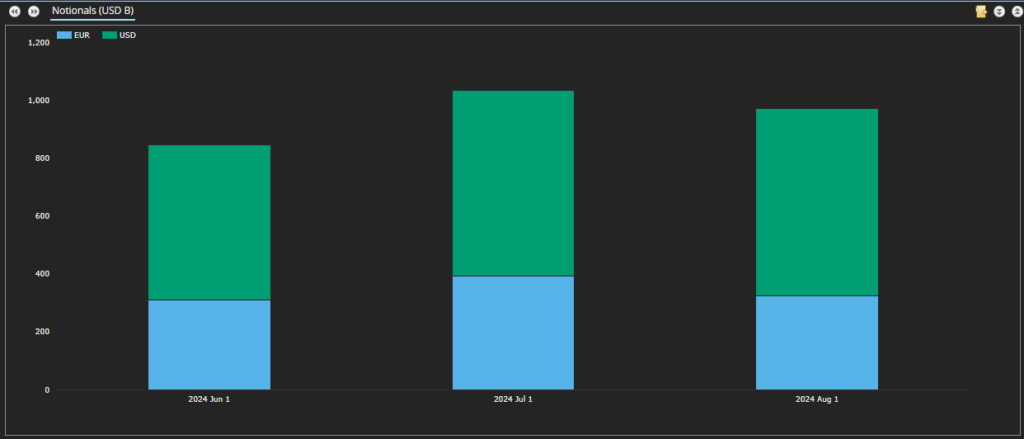
I’m not sure our data shows much support for the idea that it was straddles specifically that led to a spike in volumes. Further complicating things, we have not seen any records when looking at notional amounts traded. Here is the year-on-year analysis for the past six months:
Showing:
- Notional amounts of EUR Swaptions reported to US SDRs in EUR billions.
- March 2023 volume was actually 85% larger than in June 2024 – no records to see here.
- Overall volumes from March – July 2023 were 11% higher than the same period in 2024.
- June 2024 volumes were actually 7% lower year-on-year.
Daily EUR Swaption Volumes
Looking at the daily June 2024 volumes, the spikes in trade number have been driven by off-SEF packages of very small notional, very small premium trades:
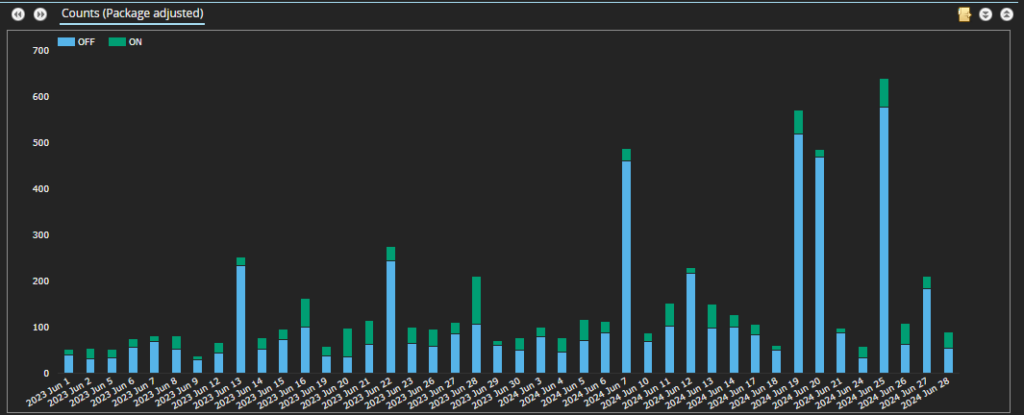
This means that we are not really seeing any records for trading activity in EUR Swaptions (at least those reported by US persons). Beware those pesky headlines…..
EUR Swaption Volumes and Heatmaps
Due to the timing of this blog, and the interesting trade numbers in June, the time period that I have looked at does not line up to a whole quarter – rather I used June, July and most of August 2024.
In terms of relative size to the USD swaptions market….
….the EUR Swaptions market is about 40% smaller. However, this is notional reported by US Persons, which is not the entire market. In contrast, the 2022 BIS Triennial Survey thinks that EUR and USD options markets are about the same size.
With caveats caveated, let’s look at the heatmaps.
Swaptions Activity by Strike
SDR data for all EUR Swaptions reported since June 2024 (including packages) can be used to create the following heatmap of Swaption activity:
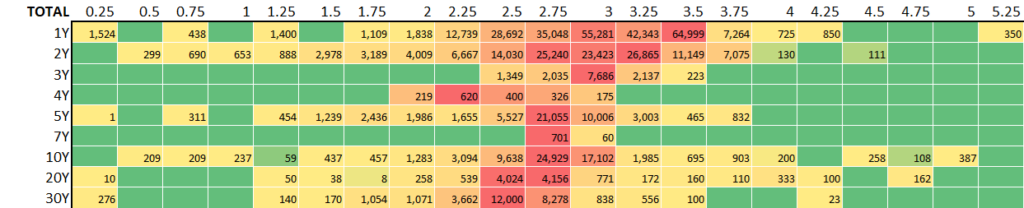
The summary of EUR swaptions activity shows;
- The notional volume (in € millions) of EUR swaptions traded in major tenors in 25 basis point strike increments.
- This covers all expiries. A 3m10y is grouped together with a 1y10y if they were traded at the same strike.
- This covers Payers & Receivers, Straddles and all other Packages.
- It looks at new volumes traded in the quarter. This is not the same as Open Interest (such as the CME Heat Maps) but it gives an idea of activity.
- Red areas show the “hottest” strikes and tenors, those with the most notional volume traded.
- We saw strikes up to 5.25% trade in the quarter (for 1Y underlyings), with activity dropping off at ~4% strikes for most of the underlyings.
- The highest strike with more than €1bn traded in a particular tenor saw €7bn+ of activity at 3.75% strike versus 1Y and 2Y tails (the underlyings are also referred to as “tails”).
- The red areas largely reflect where the at-the-money rates were as vol trading is naturally concentrated around these areas. The red areas nicely highlight the inversion of the curve as they occur at lower strikes in longer tenors.
- The most active tenor was 1Y, with €254bn traded across all strikes since June 2024.
- There is then a gap to activity in 2Y underlyings, with €127bn traded. These two tails saw much larger activity than any others.
Receivers Activity
Now looking at activity only in Receivers:
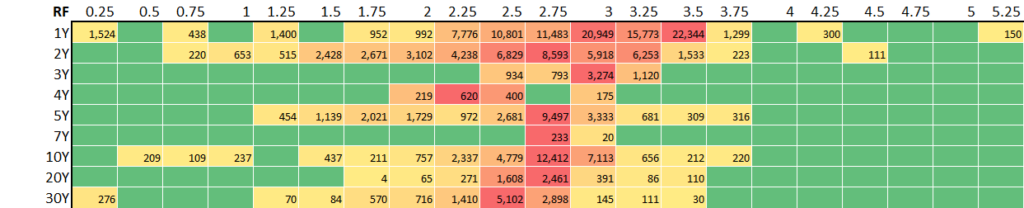
- Total activity in Receivers accounted for 39% of overall Swaption activity (measured by notional).
- The most active underlying was 1Y, across a wide range of strikes. €7bn or more traded in strikes from 2.25% up to 3.5%.
- Activity in 4Y underlyings was “only” €1.4bn, but it was all in Receivers (or straddles). There have been no 4Y payers reported for almost three months – why? Activity was reasonably spread-out, across 2-3% strikes.
Payers
And for Payers only;

- Payers accounted for 31% of total EUR Swaptions activity as measured by notional – quite a bit lower than Receivers.
- The most active underlying and strike was 1Y 3.5%, with €19bn traded. The same structure saw more than €22bn traded in Payers however…..maybe the relative imbalance is what we should be monitoring here.
- 30Y underlyings were relatively more active in Payers this quarter, with 46% of all activity in Payers. The most active strike was 2.5% seeing over €5bn traded.
Straddles
And finally the Straddles Heatmap:
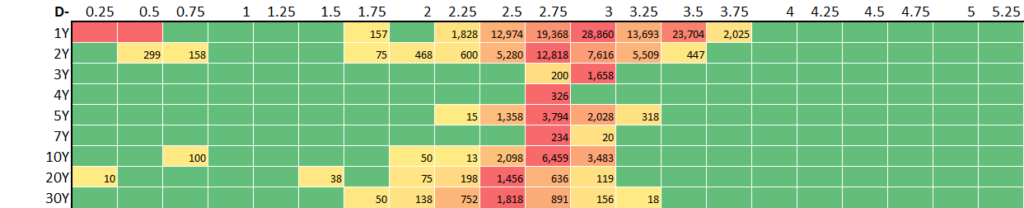
- Due to the product, the range of strikes is naturally more compressed for Straddles. A Straddle is a combination of a Receiver Swaption and Payer Swaption with the same expiry, same underlying and same strike. Therefore, if Rates do not really move, both Payer and Receiver positions will expire worthless, and the premium paid (or received) will constitute a loss (or gain).
- Straddles accounted for 30% of total swaption notional traded. Activity in Straddles is heavily skewed toward the D2D market (with no Straddles identified on D2C SEFs since at least June 2024 in our data).
- The most traded Straddles were 1Y underlyings at 3% and 3.5% strikes. These were the most active of any instrument that we saw traded, accounting for about €25bn of activity in each (these are “package adjusted” notionals, so only one leg of the Straddle notional is counted).
- There was more activity in Straddles versus 1Y tails, than there was in outright 1Y Payers or Receivers.
In Summary
- SDR transparency into the EUR swaptions market allows us to analyse a portion of the global market.
- Heatmaps of option activity show the most active underlyings (tails) and strikes in EUR Swaptions.
- There has been a demand imbalance for Receivers versus 4Y tails in our analysis.
- Straddles saw more activity in 1Y tails than either outright Payers or Receivers.