- I am surprised to be writing this (again!) – there are new all time highs in volumes traded!
- Average Daily Volumes across Swaps, Futures and Bonds in USD Rates are now at $1.68Trn in Q3 2024.
- This is 30% higher year on year.
- There has been particularly strong volume growth in long-dated US Treasury trading (30Y) and in 10Y ETDs.
- More trading is taking place in ETDs across all maturities.
USD Outright Volumes
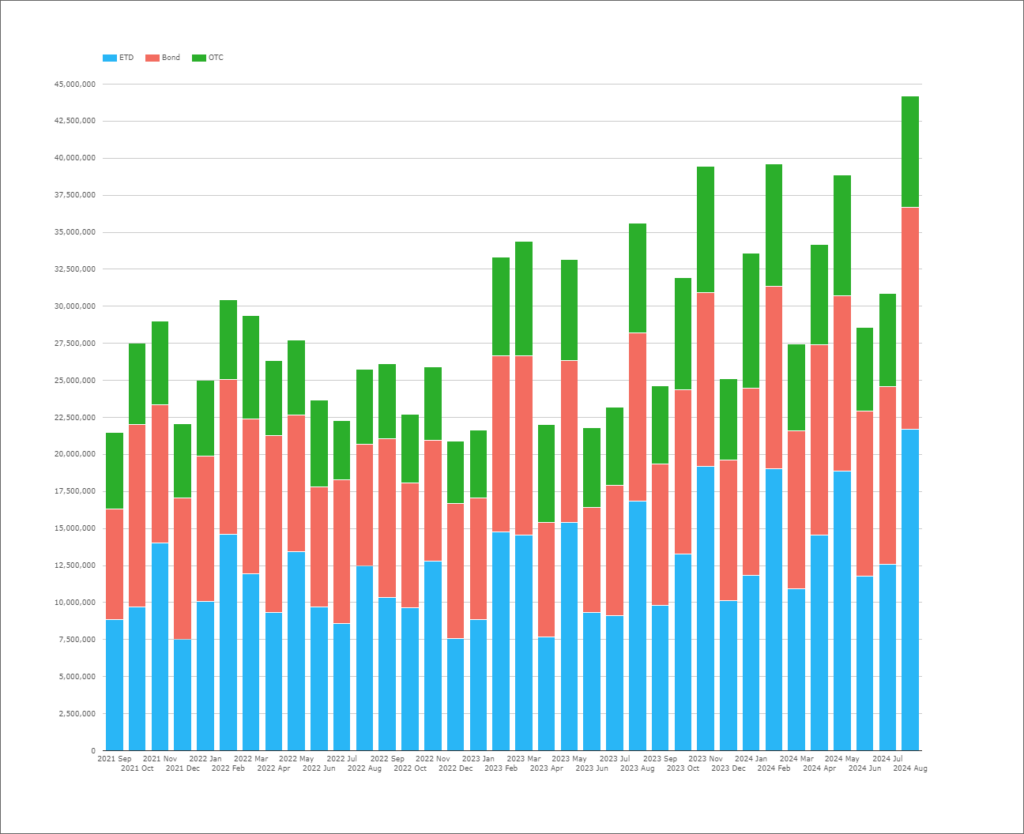
The chart below shows monthly volumes since Sep 2021:

Showing;
- Monthly volumes in notional equivalents across all long-dated USD rates products.
- The chart looks at all products with tenors longer than 2Y – covering Bonds (US Treasuries), ETD (bond futures) and OTC (interest rate swaps and OIS).
- The chart shows that August 2024 recorded all time record volumes in USD Rates!
- Despite authoring the blog, I really was not expecting that! I thought we had one crazy week in August and then things calmed down?
- Was the volatility really that extreme? Summer months are meant to be the quiet ones!
- 2023 (which was a record year) saw six months (half the year!) when volumes were over $30Trn equivalent.
- 2024 has already seen six months with volumes over $30Trn.
- We should remember this if volumes decrease ahead of the election. Is lots of trading being “front-loaded” this year?
And we shouldn’t avoid the chance to present another impressive chart. Average Daily Volumes in USD Rates keep on increasing each quarter:
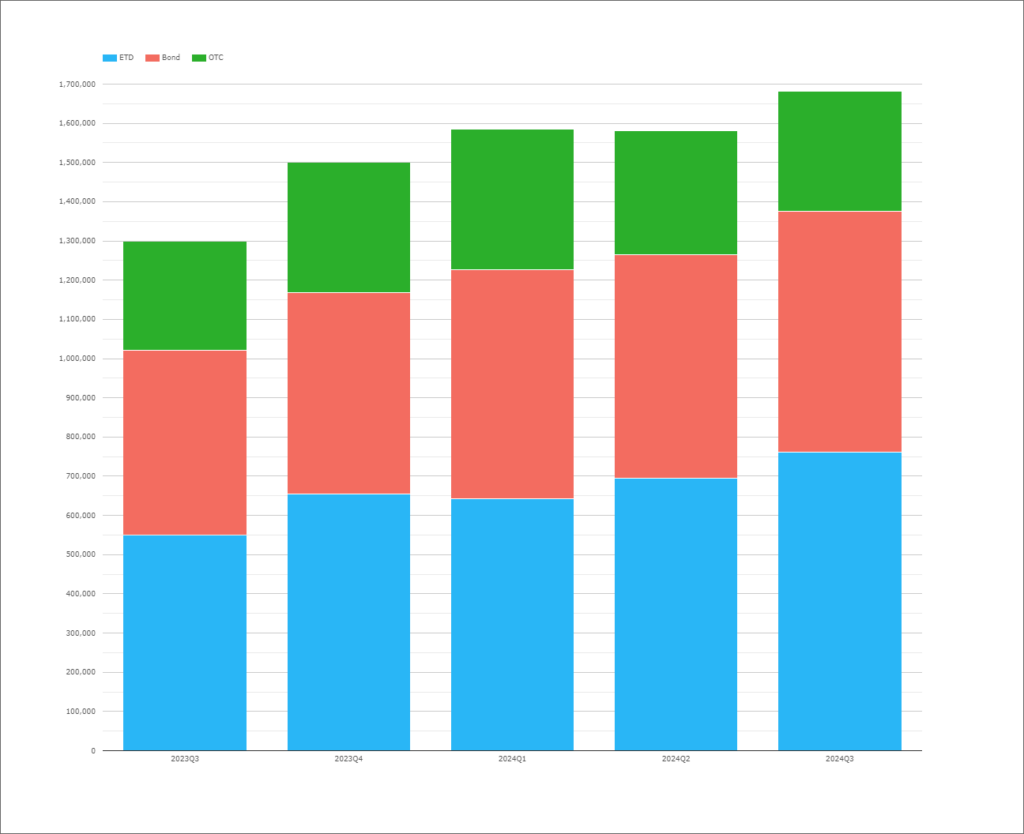
Will September 2024 be busy enough for us to close the quarter with another record? Stay tuned to the Clarus blog for updates.
Product Split in USD Rates
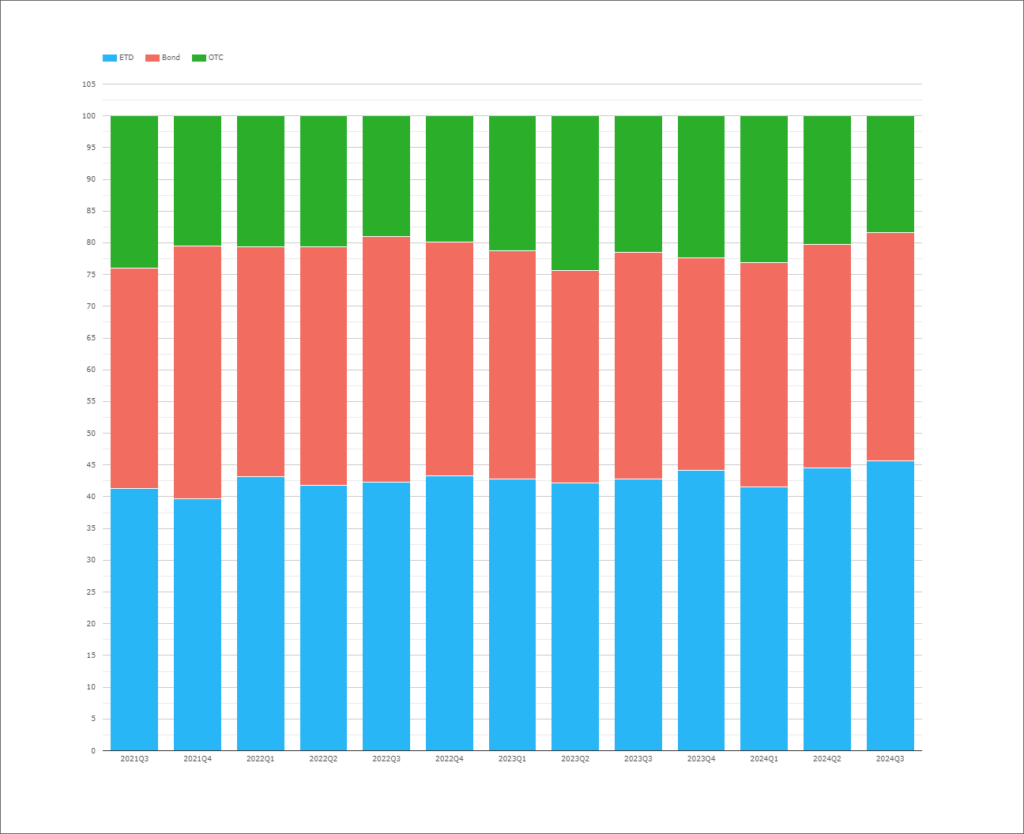
The chart below shows the percentage of volumes traded in each product type:
Showing;
- ETDs (Bond Futures) have hit a new high as a percentage of notional traded. They have accounted for 44-46% of notional in the past two quarters.
- The increased usage of ETDs has seen the market share of Bonds reduce very slightly.
- Bonds (USTs) made up 38% of traded volumes in H2 2021. That has since reduced to 36% in 2024. Is a 2% drop really relevant though?
- OTC markets accounted for 21% in 2021, and still account for 21% in 2024.
- Exchange Traded Derivatives (Bond Futures) are the “largest” of the three markets. Useful for considering where the most “liquidity” lies if you have a large chunk of risk to move.
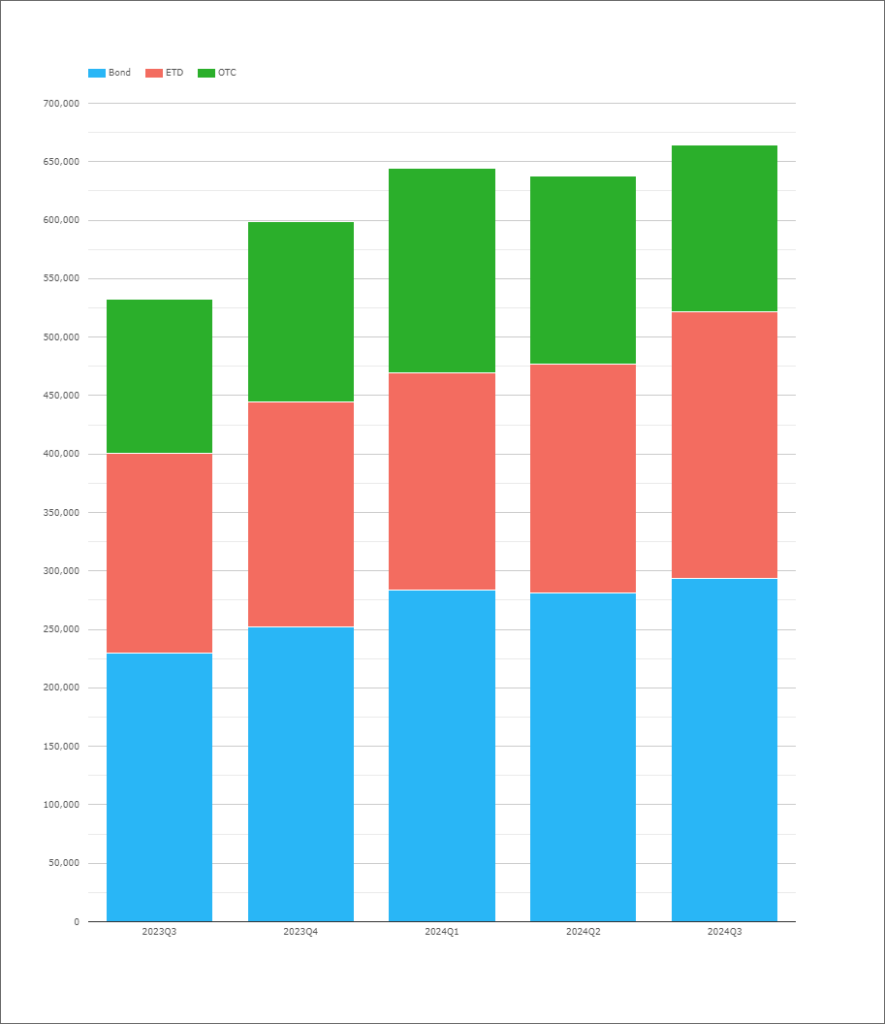
10 Years
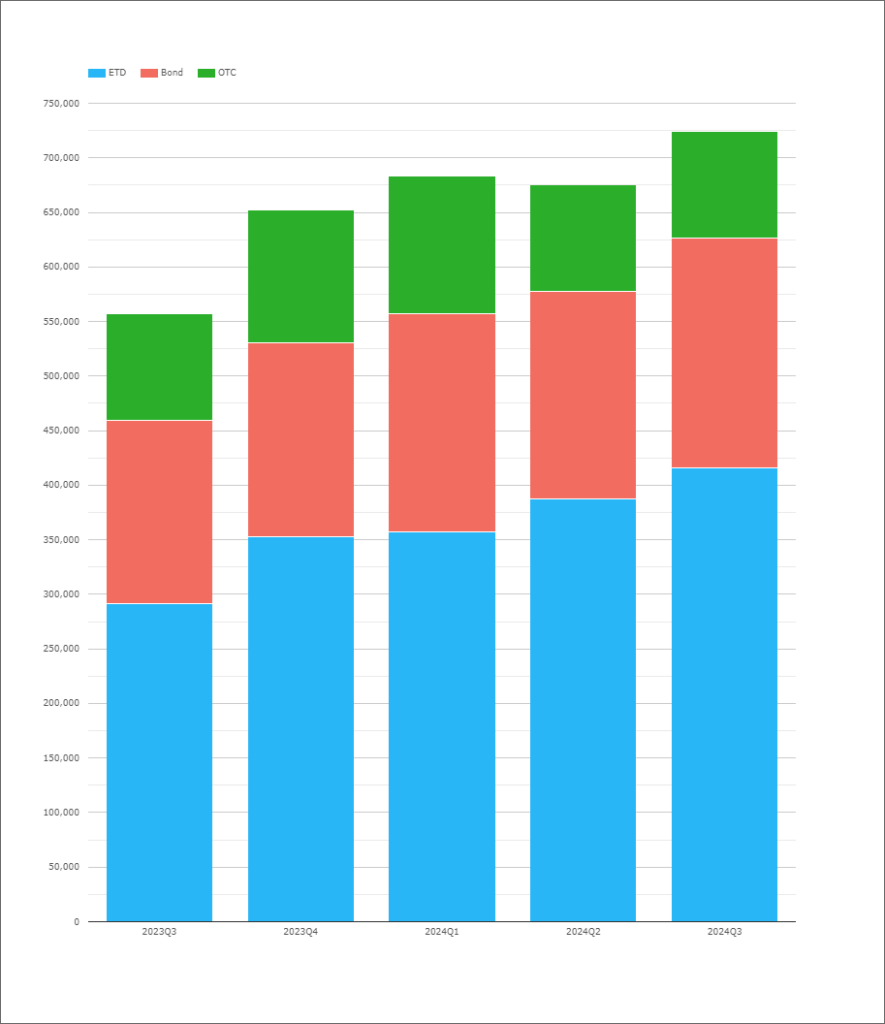
We can run the same analysis by any tenor we choose. The 10Y area of the curve is up first:

Showing;
- Average Daily Volumes in the 7Y-10Y area of the curve. This therefore covers both the CME T-Note and the CME Ultra-10Y ETD contracts.
- For cash bonds, ADVs have increased by 26% from Q3 2023 to Q3 2024 (so far).
- ETD saw even larger growth in volumes, increasing by 43% to stand at over $415bn per day in Q3 2024.
- OTC has been pretty flat since 2023, recording ADVs of $98bn in this area of the curve.
- ETDs therefore accounted for 57% of all volumes in the (7Y-) 10Y area of the curve, up from 52% in 2023.
Long Rates – 30Y
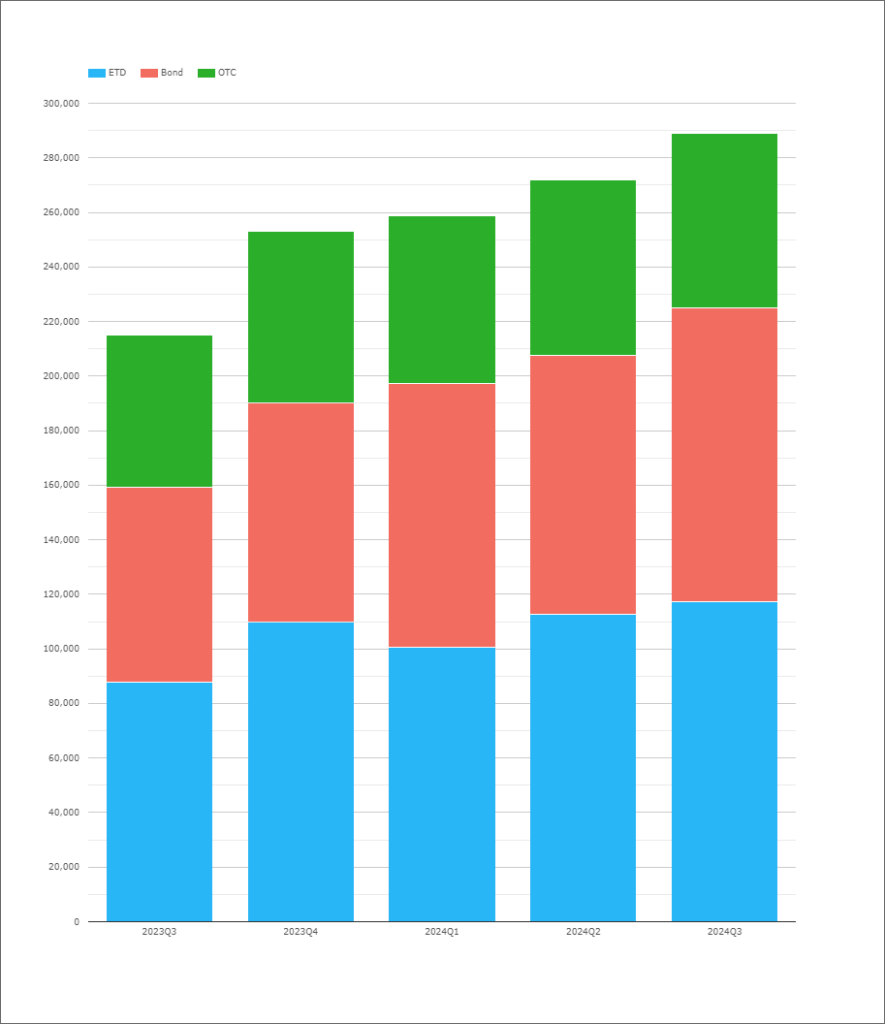
Showing;
- Volumes longer than 15Y. Ideally we would look just at 30Y, but the CME “long bond” UST future has a deliverable maturity of 15Y so it makes sense to compare with USTs and Swaps of similar maturities.
- Average Daily Volumes in ETDs increased by 34% since 2023. This meant they made up 41% of traded volumes in 2024, identical to last year.
- OTC derivatives are the least traded asset class in these long-dated maturities, with volumes further reducing from 26% to 22% of total volumes (despite OTC volumes actually growing by 14% over the period).
- Long dated cash bond USTs have been the real winner over the past year.
- ADVs in USTs have grown by 51% over the past 12 months, with their share increasing from 33% to 37% year-on-year.
- For all of the products, volumes have grown in the past year, but the relative share of products feels like it is moving away from OTC.
5 Years
- US Treasury volumes account for the largest share of volumes in the short-end of the curve.
- USTs accounted for 43% of monthly volumes in 2023. They have grown by 28% since then, but their overall share of volumes is still 44% in 2024.
- ETDs have seen their share of volumes increasing from 32% to 34% in this area of the curve.
- OTC volumes dropped slightly from 25% to 22%.
We also note that ETD and OTC compete against Eurodollar futures for trading activity in this part of the curve (although not as much as in the 2Y and shorter tenors). Our ETD figures for this chart only look at bond futures.
Market Share
As a reminder, market share metrics for USD Rates markets have been published previously by Amir. The latest blogs are linked below:
In Summary
- USD Rates markets saw all time record volumes in August 2024.
- Monthly volumes now regularly top $30Trn notional equivalent across Futures, Swaps and Bonds.
- Average Daily Volumes in long-dated (30Y) USTs grew by 51% in the past year.
- ETDs saw a 43% growth in volumes in the 10Y area of the curve.
- Average Daily Volumes across all products have grown by 30% year on year.