- 60-70-30 are the three numbers you need to know for RFR Trading now.
- 60% is the percentage of global trading that takes place against RFRs.
- 70% is the amount of the USD market that trades versus SOFR, down from 80% in Q2.
- 30% is the amount of the EUR market that trades versus €STR.
Time for a quarterly check-in on RFR trading. The data provides a high-level overview of trading activity across all Rates products.
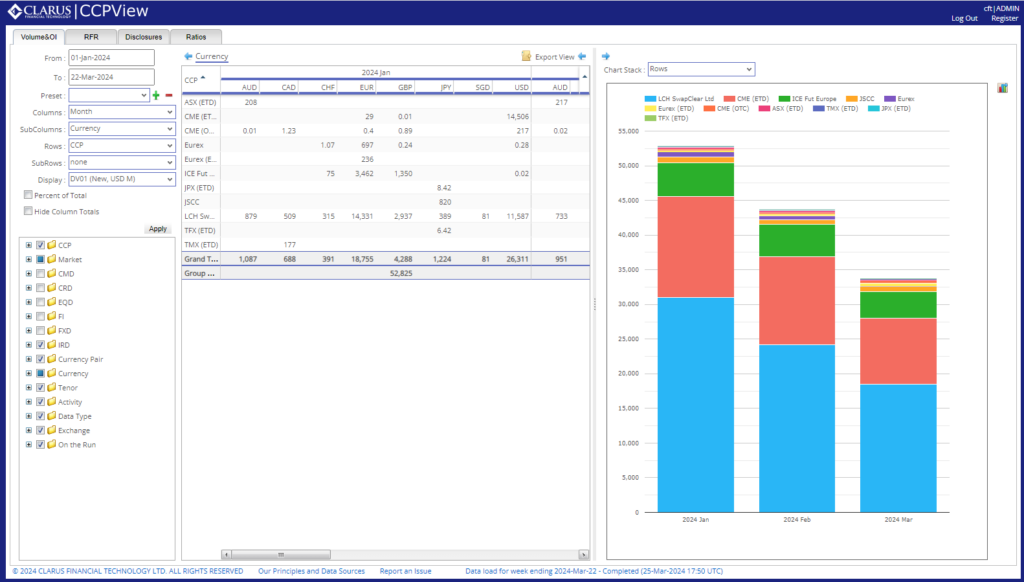
Clarus API – CCPView
As a reminder from previous blogs, Clarus microservices allow me to query numerous volume measures from CCPView. That means I have rebuilt the RFR Adoption Indicator using just two queries to pull in DV01s traded across all products in eight currencies:
RFR Adoption Q3 2024
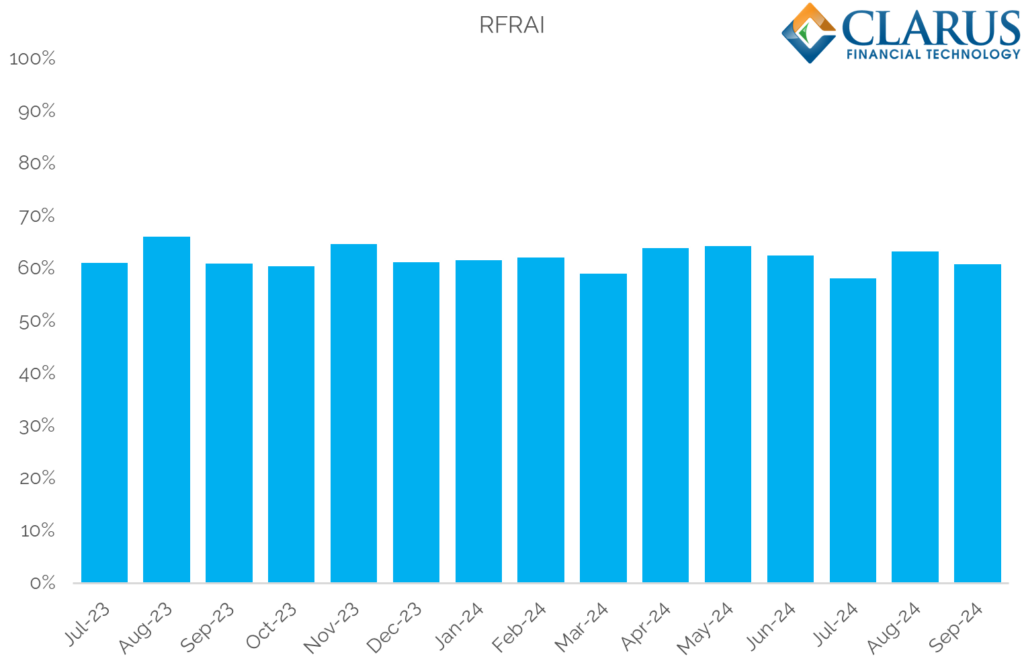
Stability. That is the key word for the past year when you look at the evolution of RFR trading as a percentage of all risk traded:
Showing;
- As of September 2024, the RFR Adoption Indicator stands at 61% vs 61% in September 2023 (yes, it really is unchanged over the past 12 months).
- It has been between 58% and 66% since the end of Q1 2023.
- There is no particular pattern to the monthly variations.
- It was 63% in August, when exceptionally large volumes were traded.
RFR Trading in USD

Starting with USD:
- September 2024 saw 67% of all USD risk traded in SOFR, down from 70% in September 2023.
- This is lower than the all time highs we saw during Q2 2024.
- Q3 2024 ranged from 67%-71%, down from 70-76% in Q3 2023.
- These numbers mean that more Fed Funds risk is trading – probably as a result of the market adjusting monetary policy expectations.
- These numbers include both Swaps and Futures. If we look at only Swaps, the amount of risk traded versus Fed Funds really jumped in Q3 2024. It rose from just 7% to 24%!

RFR Trading in EUR
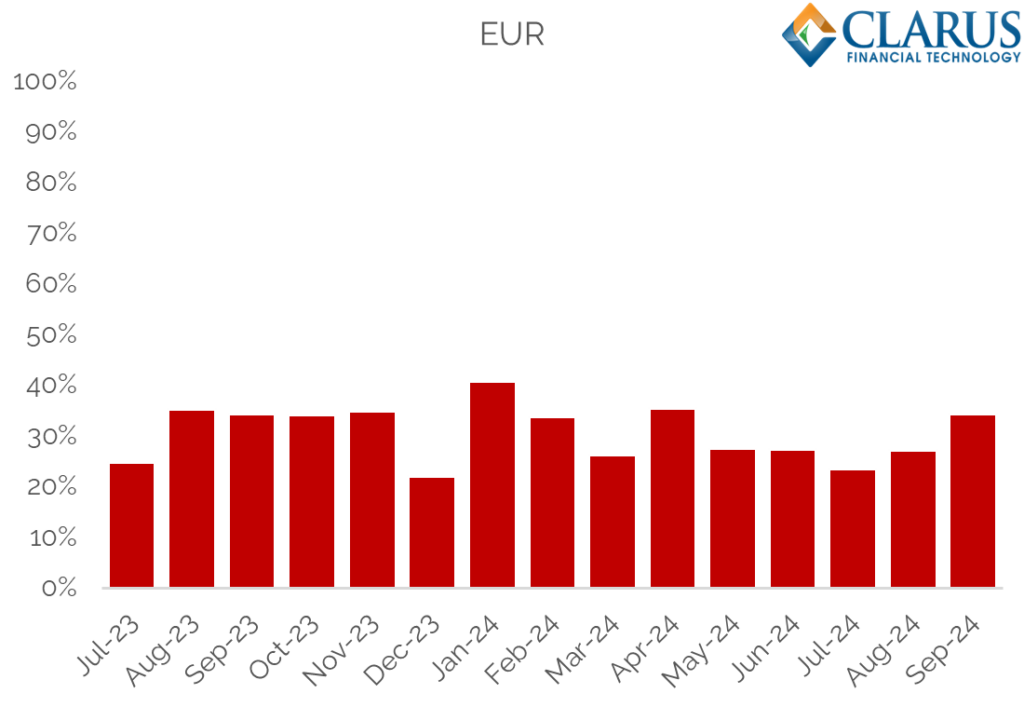
The “fight” for market share in EUR €STR futures continues apace, whilst Swaps market share (as a result of “active accounts“), is fairly static. The headlines:
- September 2024 saw 34% of all EUR risk traded versus €STR. It was also 34% in September 2023, but has clearly been volatile in-between!
- Q3 2024 ranged from 23% – 34%, compared to 25-35% in Q3 2023.
Comparing the EUR and USD Rates markets provides some useful benchmarks:
- There was 83% more DV01 traded in USD (Swaps and Futures) than in EUR during Q3 2024.
- Swaps markets in EUR and USD were the same size in Q3 – with $30bn DV01 traded in each.
- Futures markets in USD rates are 3.9 times larger than in EUR.
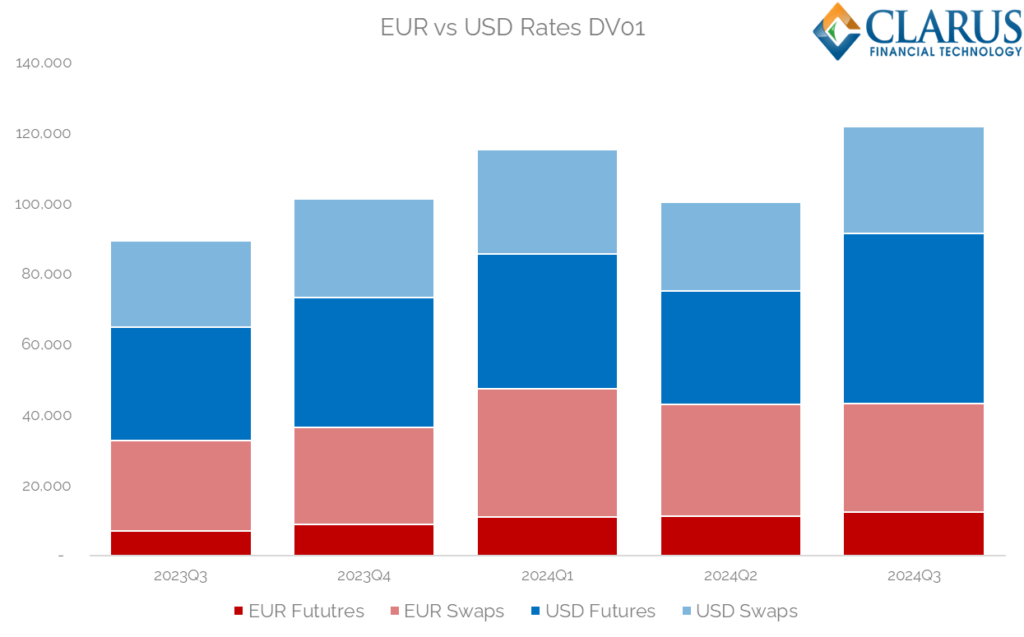
- USD is therefore still the largest component of the overall RFR Adoption Indicator (because it looks at total risk).
- Our data subscribers can cut this data any which way they choose using simple API queries.
RFR Trading in CAD
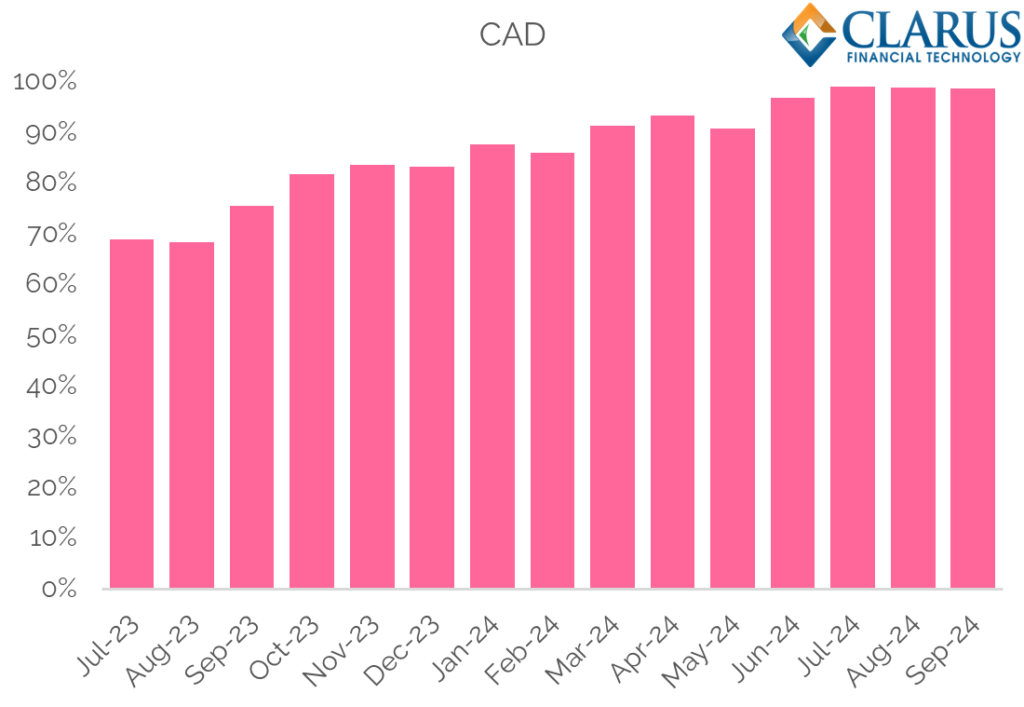
Showing;
- CAD CDOR publication ended on 28th June 2024.
- CORRA adoption has now reached 99%.
- It was 76% in September 2023.
- With CORRA the only available index, no surprises are expected from here.
RFR Trading in AUD
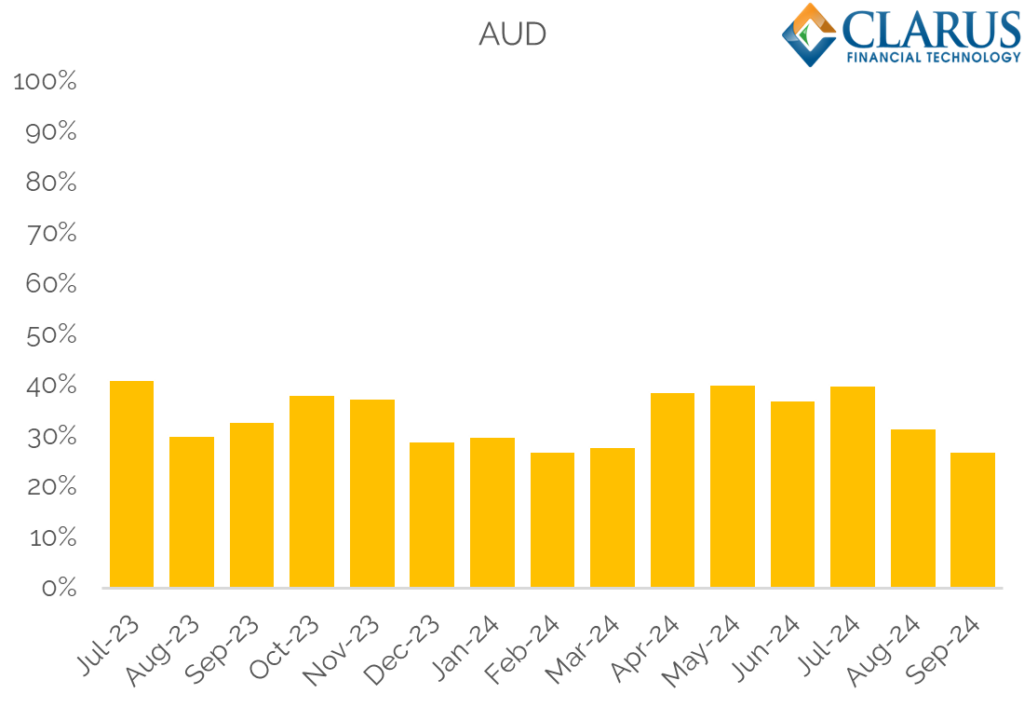
- AUD is the other currency pursuing a multiple rate/index future. Check out the blogs here and here plus the podcast on AUD swaps for my thoughts on that!
- AONIA trading accounted for only 27% of total AUD rates risk traded in September 2024, compared to 33% a year earlier.
- Q3 2024 ranged from 27% – 40%, compared to 33-41% in Q3 2023.
In Summary
- 60% of global rates trading occurs versus Risk Free Rates.
- This has been consistent during 2024.
- In Q3 2024, it was most volatile in AUD, ranging from 27-40%.
- In USD Swaps, the amount of risk traded versus Fed Funds jumped from just 7% to 24%.
- EUR and USD swaps markets were the same size in Q3.