OMG. The last time I wrote about CAD Swaps was in 2017! Seven years later, what has changed? (Skip to the Summary to find out 😛 ).
CDOR-CORRA Conversion
The not-so-new news is that CDOR will cease in four days time (28th June 2024 will be the last fixing ever published). I have covered the transition to RFR trading in CAD a few times (so I have kind of written about CAD swaps since 2017):
ISDA (in collaboration with Clarus) included CAD in the 8 currencies that make up the RFR Adoption Indicator. In December 2023, 83% of the CAD market was traded versus CORRA. Updating to end of May 2024 shows:

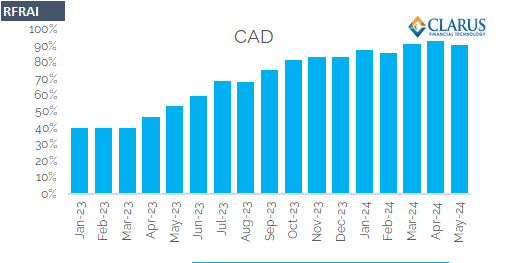
- CORRA adoption has continued to increase in 2024.
- It reached a high of 93.5% of all CAD risk in April 2024.
- CAD markets look to be in a really strong position to transition smoothly away from CDOR.
CAD is probably “ahead of the curve” compared to almost every other currency that has transitioned to RFRs – no cliff-edge conversions to see here.
The Data on Conversion
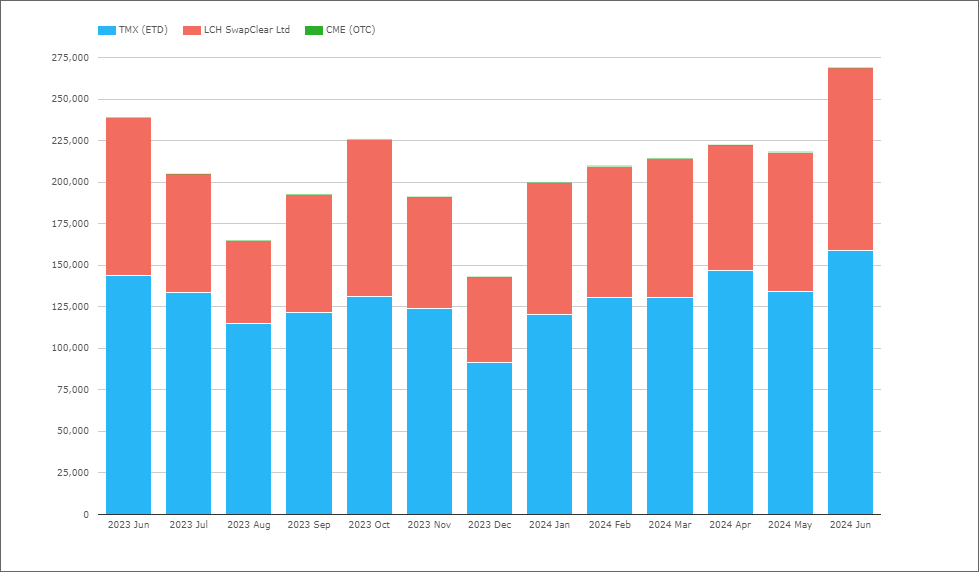
Both LCH SwapClear and CME have now converted most of the outstanding cleared OTC CDOR swaps into CORRA, creating a cool chart in the process (maybe I need to get out more?!) 😛

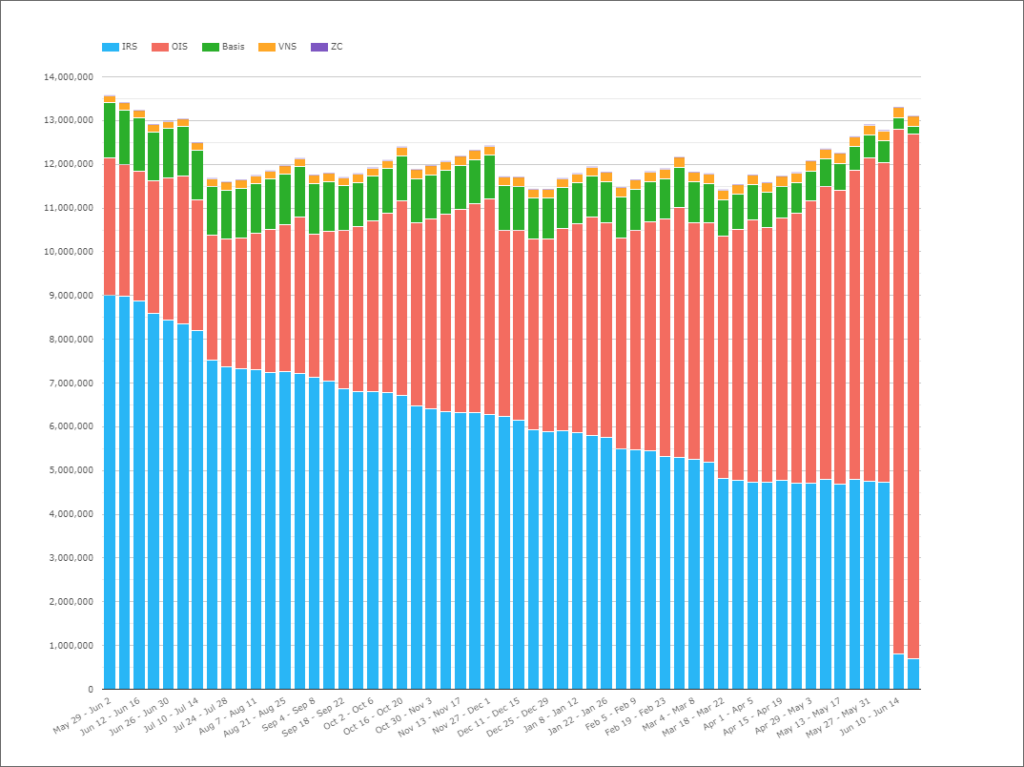
The remaining slithers of blue at the bottom are related to trades that have the last “representative” CDOR fixings, so will amortise down to zero over the next three months.
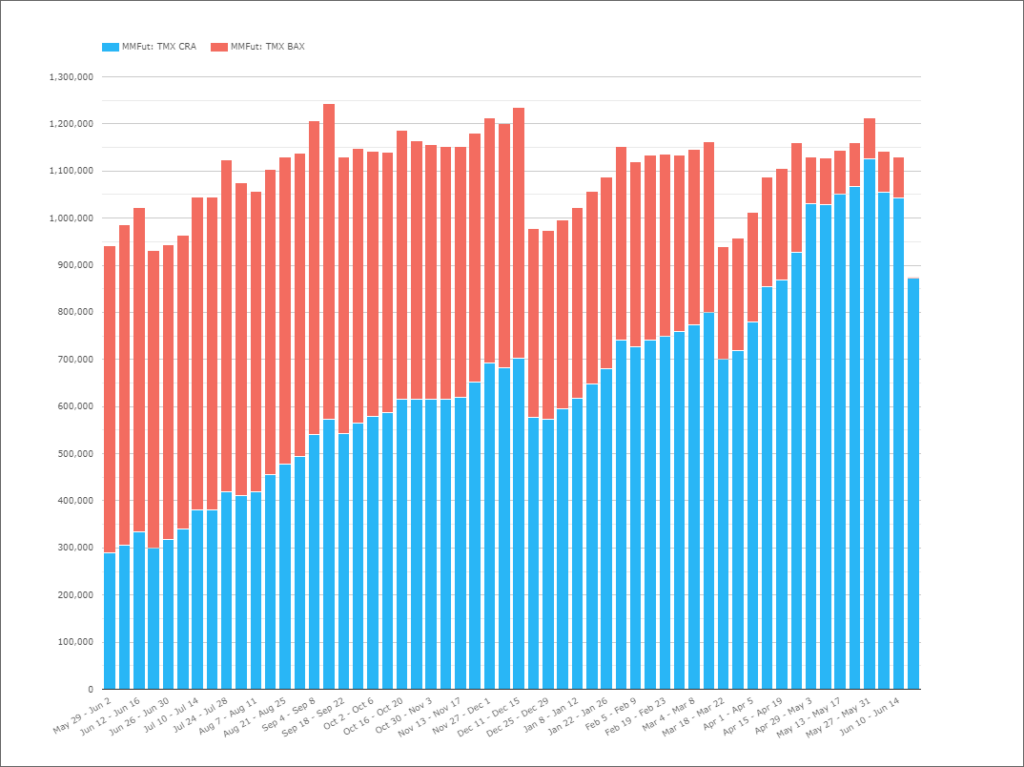
The CCPs have published plenty of material on the conversion exercises (CME here and here, LCH SwapClear here, TMX here). TMX have also converted CDOR futures into CORRA, also shown in our data from CCPView:
CAD Market Total Size
As one of the eight currencies that we monitored in the RFR Adoption Indicator, I have a total DV01 traded in CAD every month going back quite some years. This is for all cleared Interest Rate Derivatives, covering almost all trading activity globally:

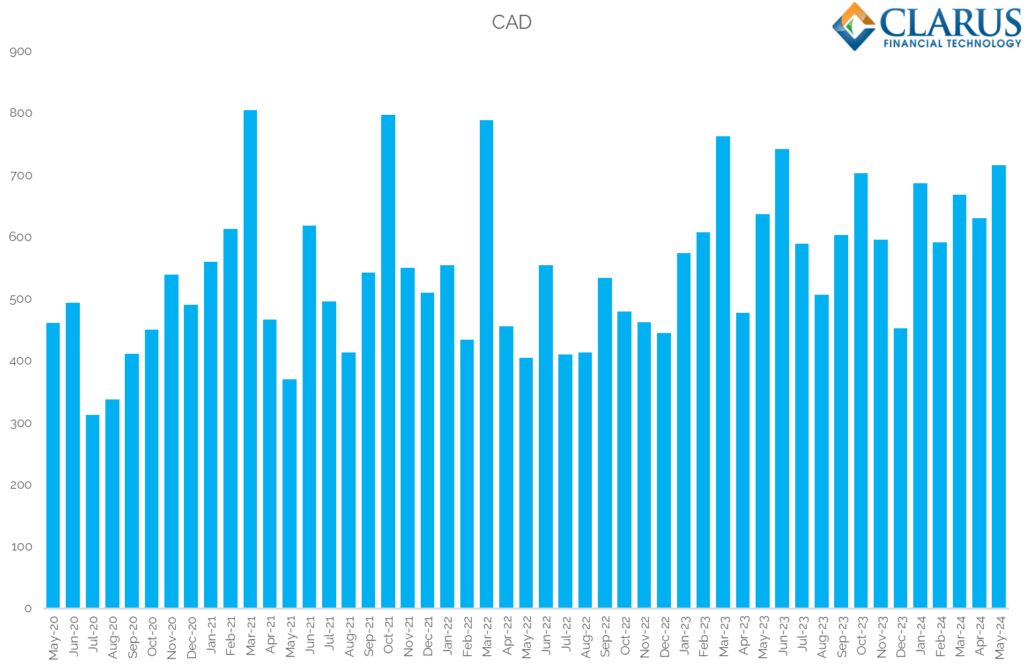
Showing;
- Levels of trading activity in CAD swaps, expressed in DV01 terms ($m equivalents).
- Some months reach $800m of DV01 traded.
- 2024 has been the busiest year on record, with average monthly DV01 traded of $659m.
- That is nearly 10% higher than 2023 average volume and some 50% higher than the quietest year on record (2020).
CAD is the sixth largest currency by volumes traded. Removing EUR and USD from the chart (we all know they are huge in comparison);

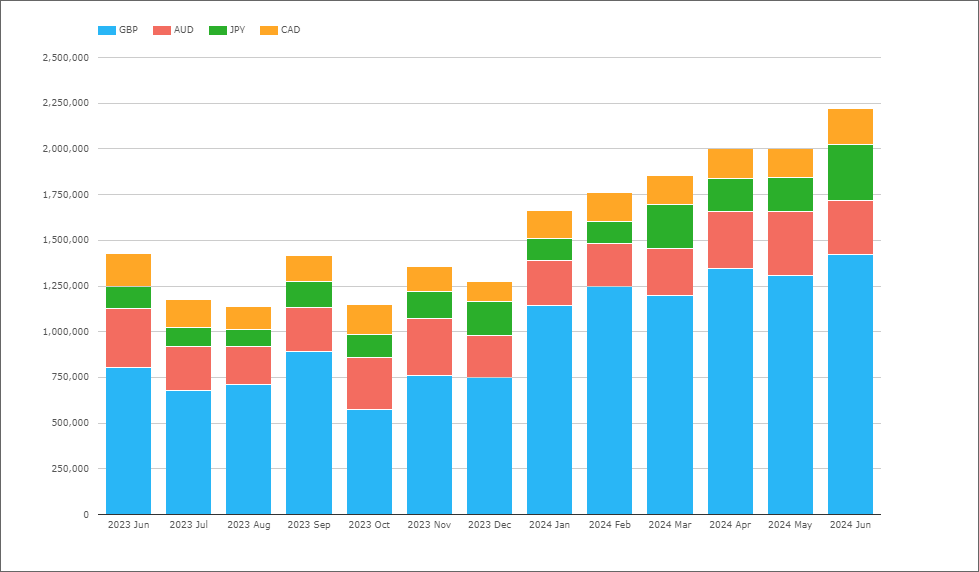
Showing;
- Average Daily Volumes in notional equivalents ($m), across both OTC and Futures markets.
- CAD and JPY markets were a similar size until recently.
- The new monetary policy outlook in JPY has increased short-end activity, increasing notional amounts traded in JPY, pushing CAD firmly into sixth place.
- Whilst we know that traded volumes in AUD can be very volatile, CAD is consistently smaller than AUD. But remember that AUD has this really convoluted market structure across BBSW, AONIA, Futures, 3s6s (listen to this podcast for my thoughts on that!).
- JPY is a better comparison, with it basically having a single index to trade against (see JPY Swaps 2024), although JPY STIRs will also be adding to volumes here (see blog on TONA futures).
Futures and Swaps in CAD
It is worth checking in to see how Average Daily Volumes in CAD Futures compare to those in CAD Swaps.
Showing;
- A remarkably stable split.
- 40% of CAD volumes are consistently in Swaps at LCH SwapClear.
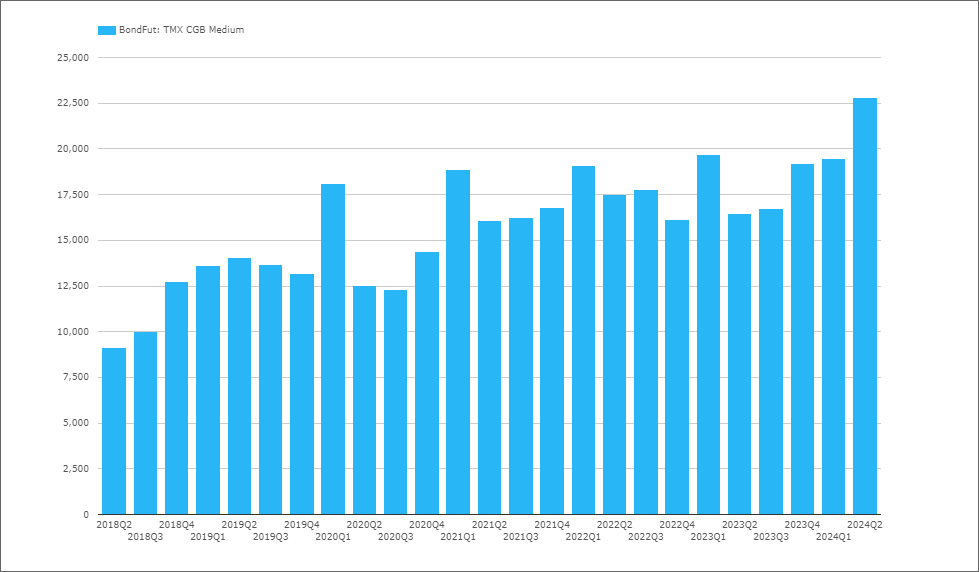
- With the 60% of volumes in Futures at TMX made up of 80% CORRA futures and 20% bond futures.
- Bond futures are larger than I expected. The chart below shows that CAD bond futures have seen significant growth over the past five years:
SEF Trading in CAD Swaps
If bond futures are flourishing as exchange traded products, how popular is the “exchange light” protocol of SEF execution in CAD Swaps?

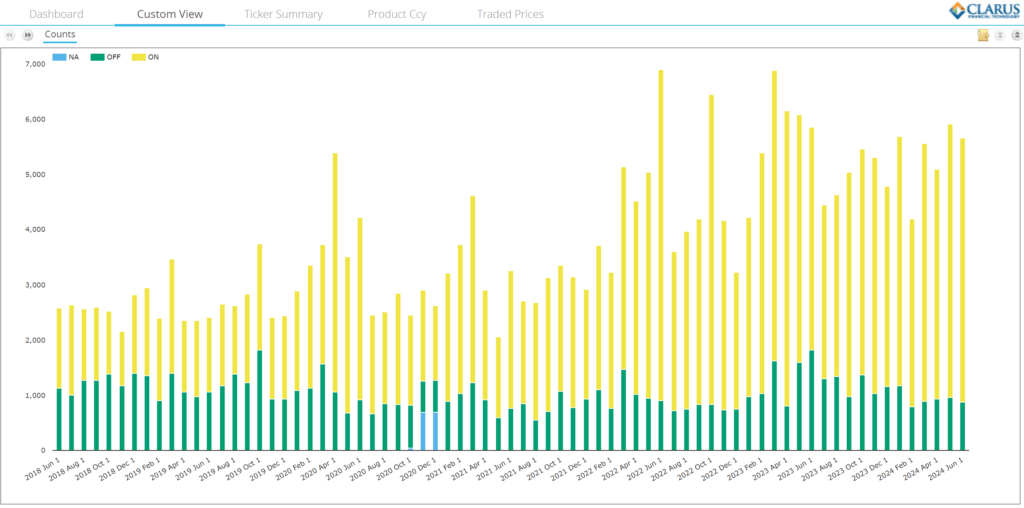
- SEF execution has really taken off in CAD swaps.
- 85% of CAD swaps are now reported as executed on-SEF.
- This is up from 50% in 2019.
- That is a big change, and SEF executed trades are really the “growth engine” at the moment.
- Remember there is no Trading Mandate in Canada (according to this 2023 ISDA overview of CAD markets), so this is all voluntary SEF execution.
D2D SEFs
There has not been much change in average daily volumes executed on D2D SEFs for CAD swaps over the past 5 years, despite the move to OIS trading:

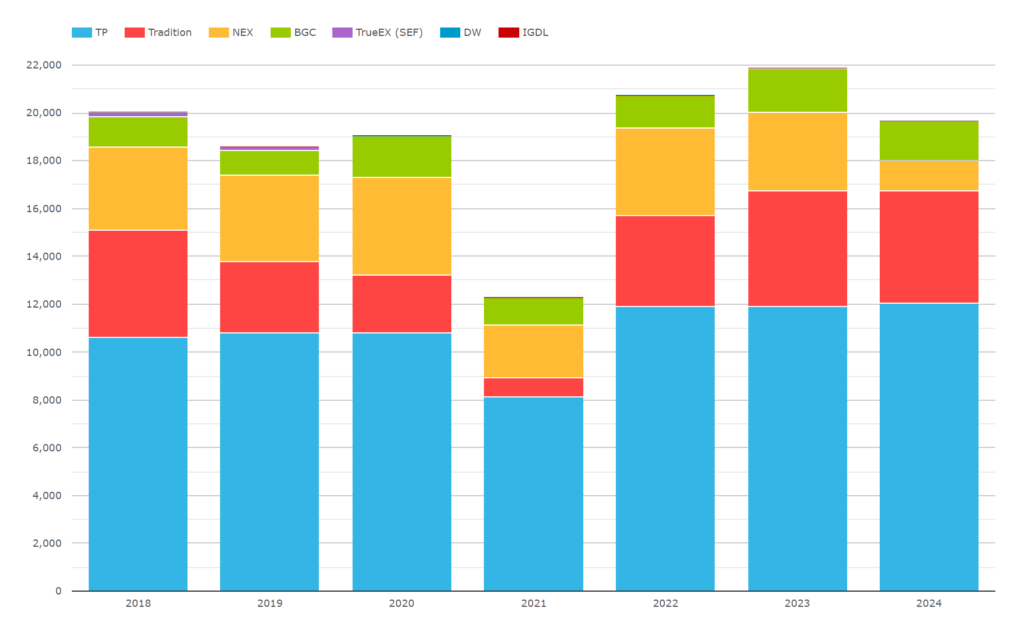
Whilst we are all relieved that volumes recovered from the 2021 nadir, I am sure there are many brokers eyeing up the growth in D2C CAD swap activity (see below).
D2C SEFs
There has been an almighty change for D2C platforms:


Showing;
- 2018-2022, SEF volumes in CAD swaps were very small – around CAD3Bn per day.
- In 2023 and 2024, something changed and – boom – volumes are now CAD16bn per day.
- These “smaller” currencies are likely benefitting from the same effect as Clearing Mandates at SwapClear.
- If you are already “plugged-in” to a SEF for trading mandated currencies such as USD, EUR and GBP, you may as well get the workflow benefits across multiple currencies.
- Electronification. Certainly not enshittification!
In Summary
- CAD is the sixth largest traded currency in interest rate derivatives markets across Swaps and Futures.
- At least $650-800m in DV01 is executed per month, with 2024 setting new records in average daily volumes (ADV).
- CAD bond futures have grown, now reaching CAD20bn of ADV.
- SEF trading on D2C platforms has exploded since 2022, reaching CAD16bn in average daily volumes.
- CAD markets are well-prepared for the final cessation of CDOR later this month.