Clearing Houses 2Q 2018 CPMI-IOSCO Quantitative Disclosures are now available, so lets look at what the data shows, similar to my 3Q 2017 trends article.
Background
Under the voluntary CPMI-IOSCO Public Quantitative Disclosures by CCPs, over two hundred quantitative data fields covering margin, default resources, credit risk, collateral, liquidity risk and more are published each quarter with a quarterly lag.
CCPView has quarterly disclosures from 30 Sep 2015 to 30 Jun 2018 inclusive, which means we can observe both trends over time at one CCP and compare CCPs to each other.
Lets take a look at a few of the main disclosures.
Initial Margin for IRS
Starting with the Initial Margin requirement for Interest Rate Swaps.
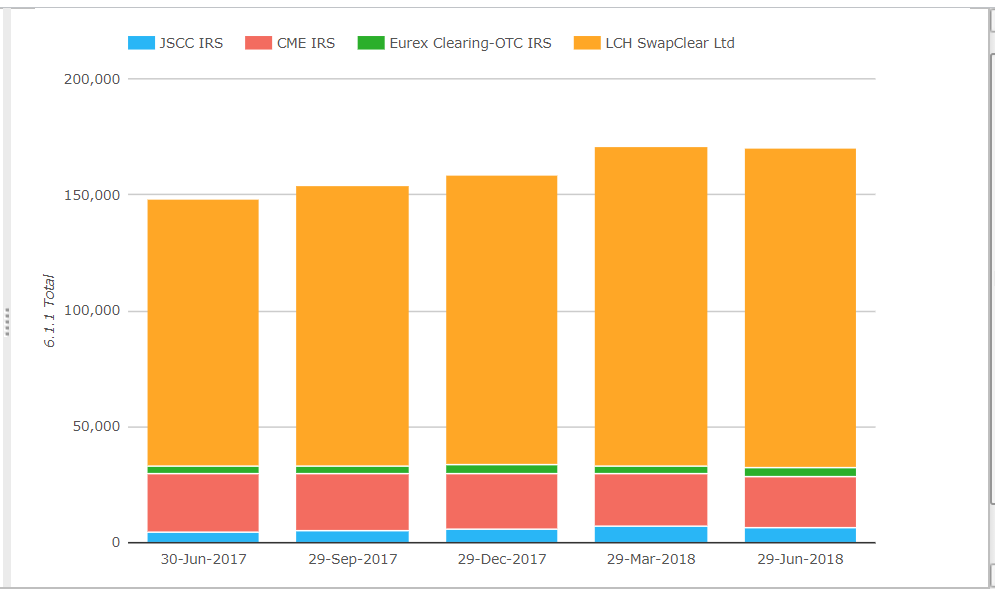
- Total IM for these CCPs is now $170 billion, up from $148 billion on 30-Jun-2017
- While the chart shows no growth between 29-Mar-2018 and 29-Jun-2018, this is actually due to FX rates, so lets look at IM changes in the base currency of each CCP
- LCH SwapClear IM is now £105 billion, up £7 billion or 7% from the prior quarter and up £16 billion or 18% from a year earlier. Client IM is up 23% over the year to reach £58 billion, compared to House IM up 13% at £47 billion; a 56% to 44% ratio in favour of Client IM.
- CME IRS IM is $22.5 billion, similar to the prior quarter but down 9% or $2 billion from a year earlier. Client IM is unchanged from a year earlier at $18 billion, while House IM is down 33% at $4.5 billion.
- JSCC IRS IM is now JPY 680 billion, down 10% from the prior quarter and up 28% or JPY 150 billion from a year earlier. Client IM is up 49% from a year earlier to reach JPY 280 billion, while House IM is up 17% at JPY 400 billion. Client IM now 41% of the total IM, up from 36% a year earlier.
- Eurex Clearing OTC IRS is now EUR 3.1 billion, up 10% from the prior quarter and up 9% or EUR 250 million from a year earlier. Client IM is up 33% from a year earlier to reach EUR 1.4 billion, while House IM is down 5% from a year earlier at EUR 1.7 billion.
LCH SwapClear with the largest increase in IM over year with £16 billion, followed by JSCC IRS with JPY 150 billion. Eurex with a small gain in IM of EUR 250 million, while CME IRS is down by $2 billion.
Initial Margin for CDS
Next lets look at the Initial Margin requirement for Credit Default Swaps.
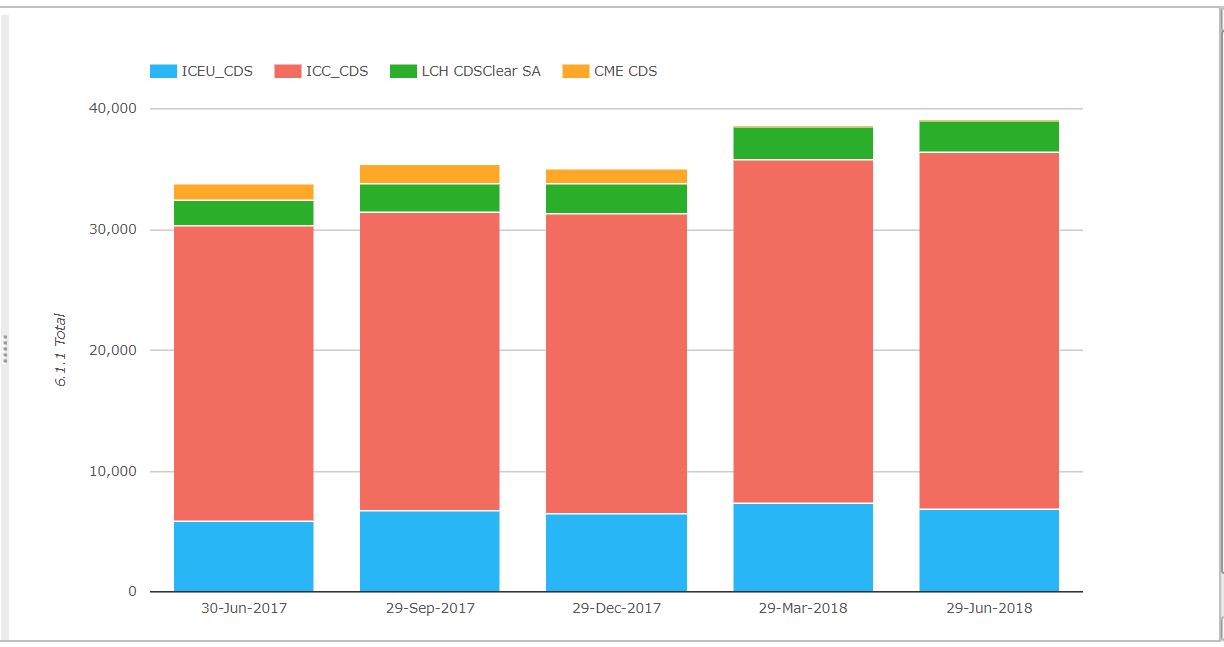
- Total IM for these CCPs was $39 billion on 29-Jun-2018
- This is up from $33.8 billion on 30-Jun-2017, an increase of $5 billion or 16%
- ICE Credit Clear by far the largest at $29.5 billion, up $5 billion or 20% from a year earlier. Client IM is up $2 billion and House IM is up $3 billion to reach $17.3 billion and $12.2 billion respectively.
- ICE Europe Credit next with EUR 5.9 billion, up EUR 800 million or 16% from a year earlier. Client IM is up EUR 600 million to reach EUR 1.1 billion, while House IM is up EUR 200 million to EUR 4.8 billion.
- LCH CDSClear with EUR 2.3 billion, up EUR 500 million or 26% from a year earlier. Client IM is only EUR 15 million compared to EUR 2.3 billion of House IM.
Growth over the year coming from each of these CCPs, with 20%, 16% and 26% at ICE Credit Clear, ICE Europe Credit and LCH CDSClear respectively.
Initial Margin for ETD
Next Initial Margin for ETD (Futures & Options).
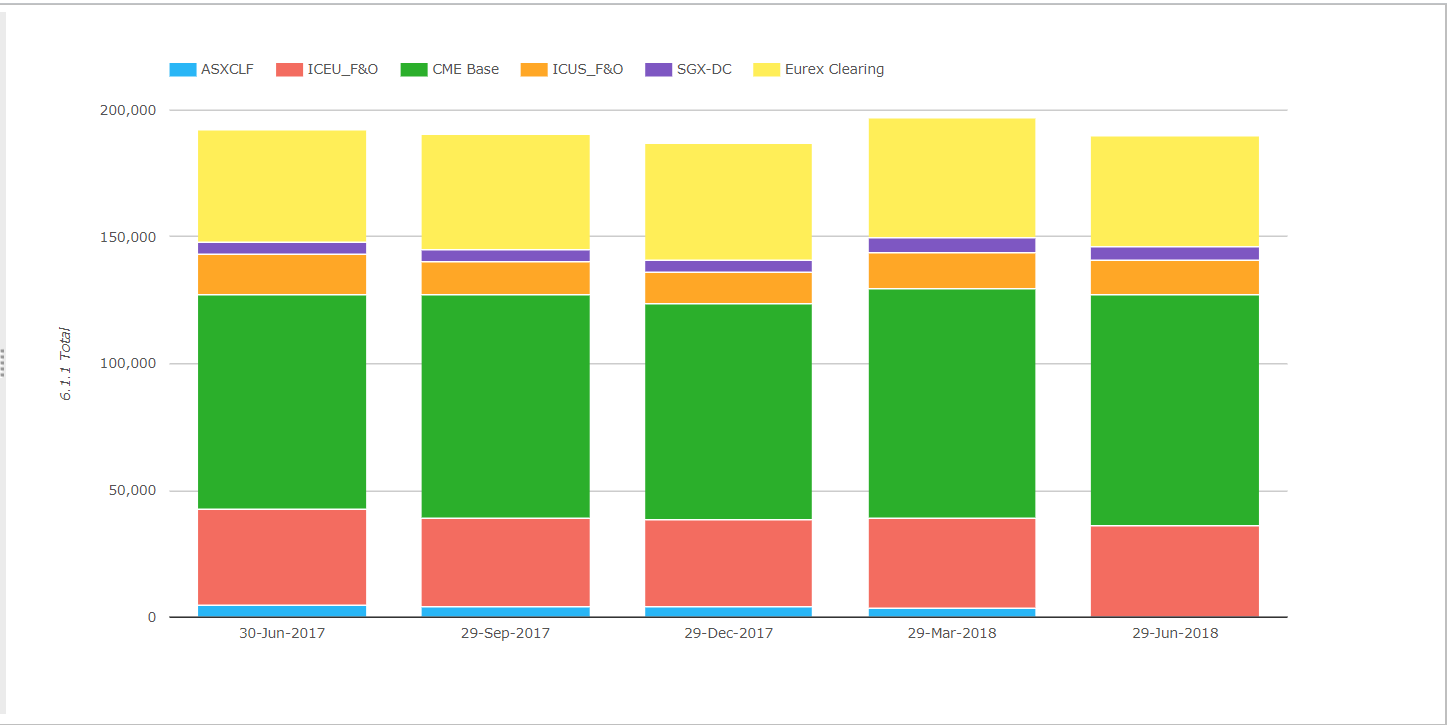
- Total IM for these CCPs was $194 billion on 29-Jun-2017
- Similar to the amount a year earlier
- CME Base is the largest with $91.6 billion, up 8% or $7 billion from a year earlier
- Eurex Clearing is next with $43.4 billion, similar to a year earlier
- ICE Europe F&O is $36 billion, down 6% a year earlier (in USD terms)
Not a lot of change to comment on in ETD.
Other Disclosures of Interest
While there are lots of further disclosures covering margin, default fund, credit risk, liquidity and more, I will just highlight a few of these:
- Nasdaq Commodities shows Client Gross IM required increased to EUR 514 million from EUR 149 million, I wonder if that has anything to do with increasing risk taken on by Einar Aas leading up to the default in September?
- Nasdaq Commodities 4.4.3 Estimated largest aggregate stress loss (in excess of initial margin) that would be caused by the default of any single participant and its affiliates in extreme but plausible market conditions; Peak Day Amount in previous 12 months increased to EUR 142 million from EUR 94 million in the prior quarter.
- LCH SwapClear, number of client accounts increased to 20,211 from 19,690, a similar increase to the prior quarter, so no sign of any slowdown on more client’s clearing at LCH
- LCH ForexClear Total IM is now $6 billion, up from $4.7 billion a year earlier
- JSCC Total IM is JPY 680 billion, up from JPY 530 billion a year earlier, with 16 domestic participants, 7 foreign participants and 100 clients (up from 81 a year earlier).
- HKEX OTC Clear has 6 domestic participants and 15 foreign participants, up from 9 a year earlier
- OCC Total IM is $64 billion of which Client IM is the majority at $51 billion and there are 104 clearing members, of which 9 are foreign and the five largest clearing members hold 54% of open positions.
More Disclosures
CCPView has disclosures from twenty six Clearing Houses, each with many Clearing Services, so there is a lot more data to look at covering Equities, Bond, Futures, Options and OTC Derivatives.
With over 200 quantitative data fields and quarterly figures from September 2015 to June 2018, there is a lot of data to analyse.
If you are interested in this data please contact us for a CCPView subscription.